The Rise of Private Sharing on Social Networks
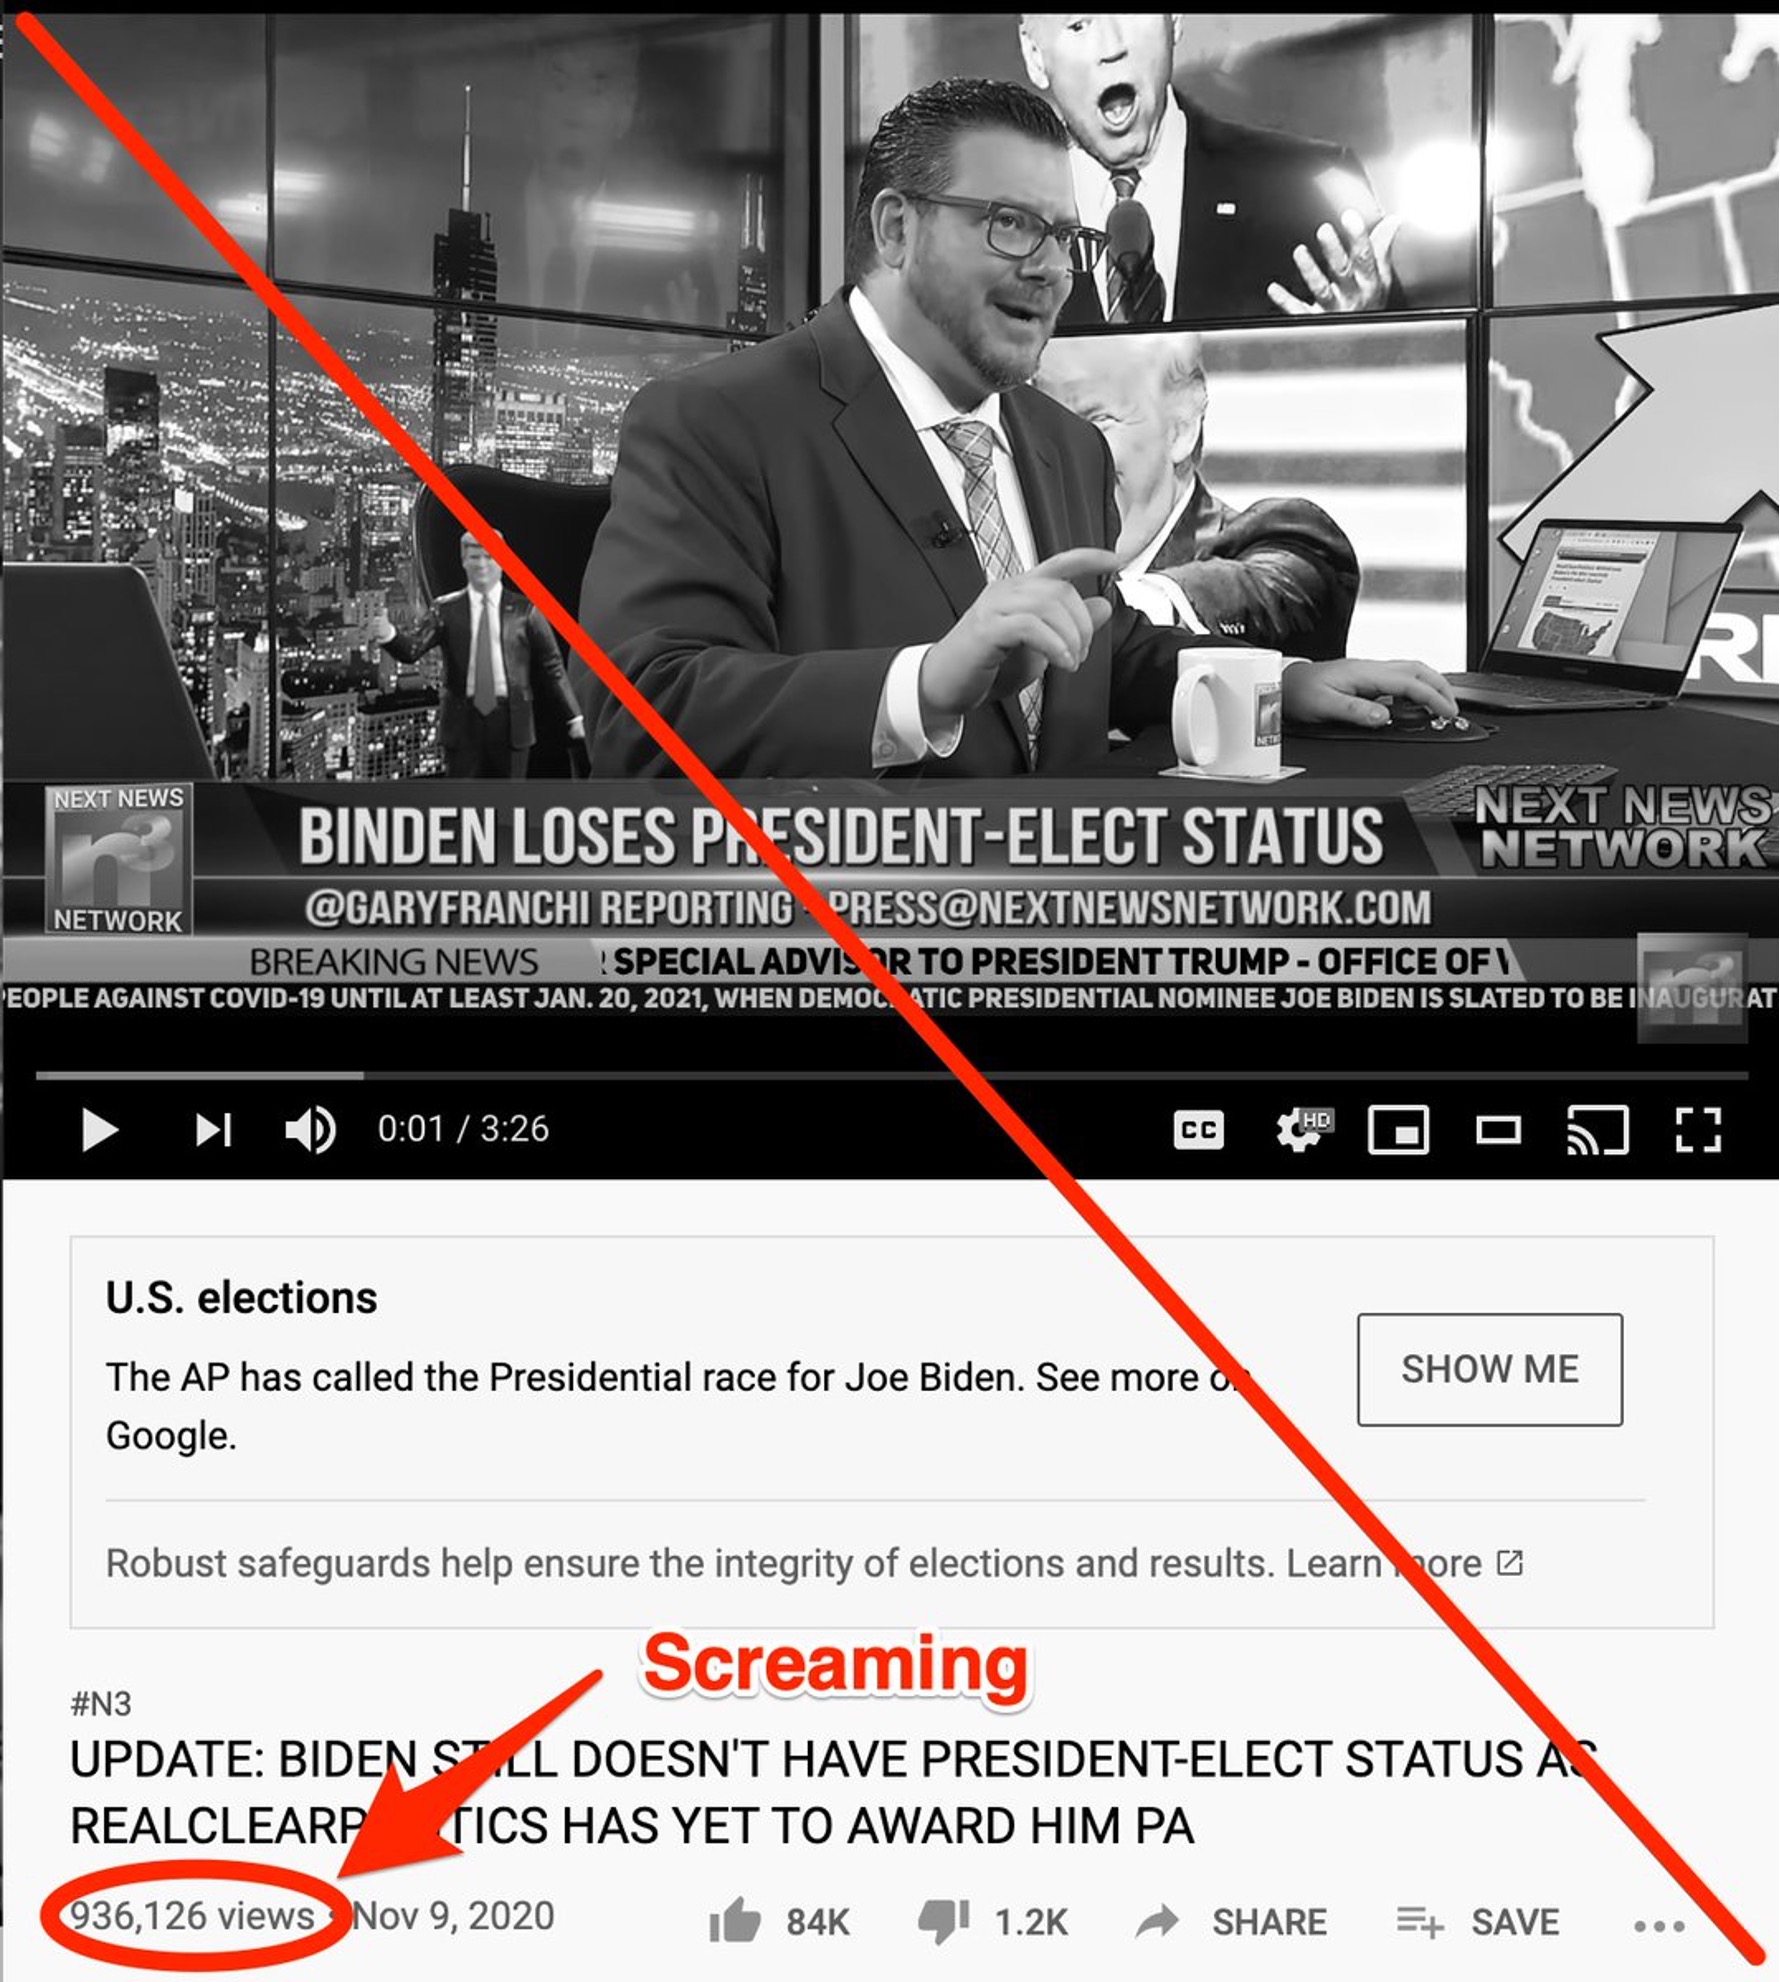
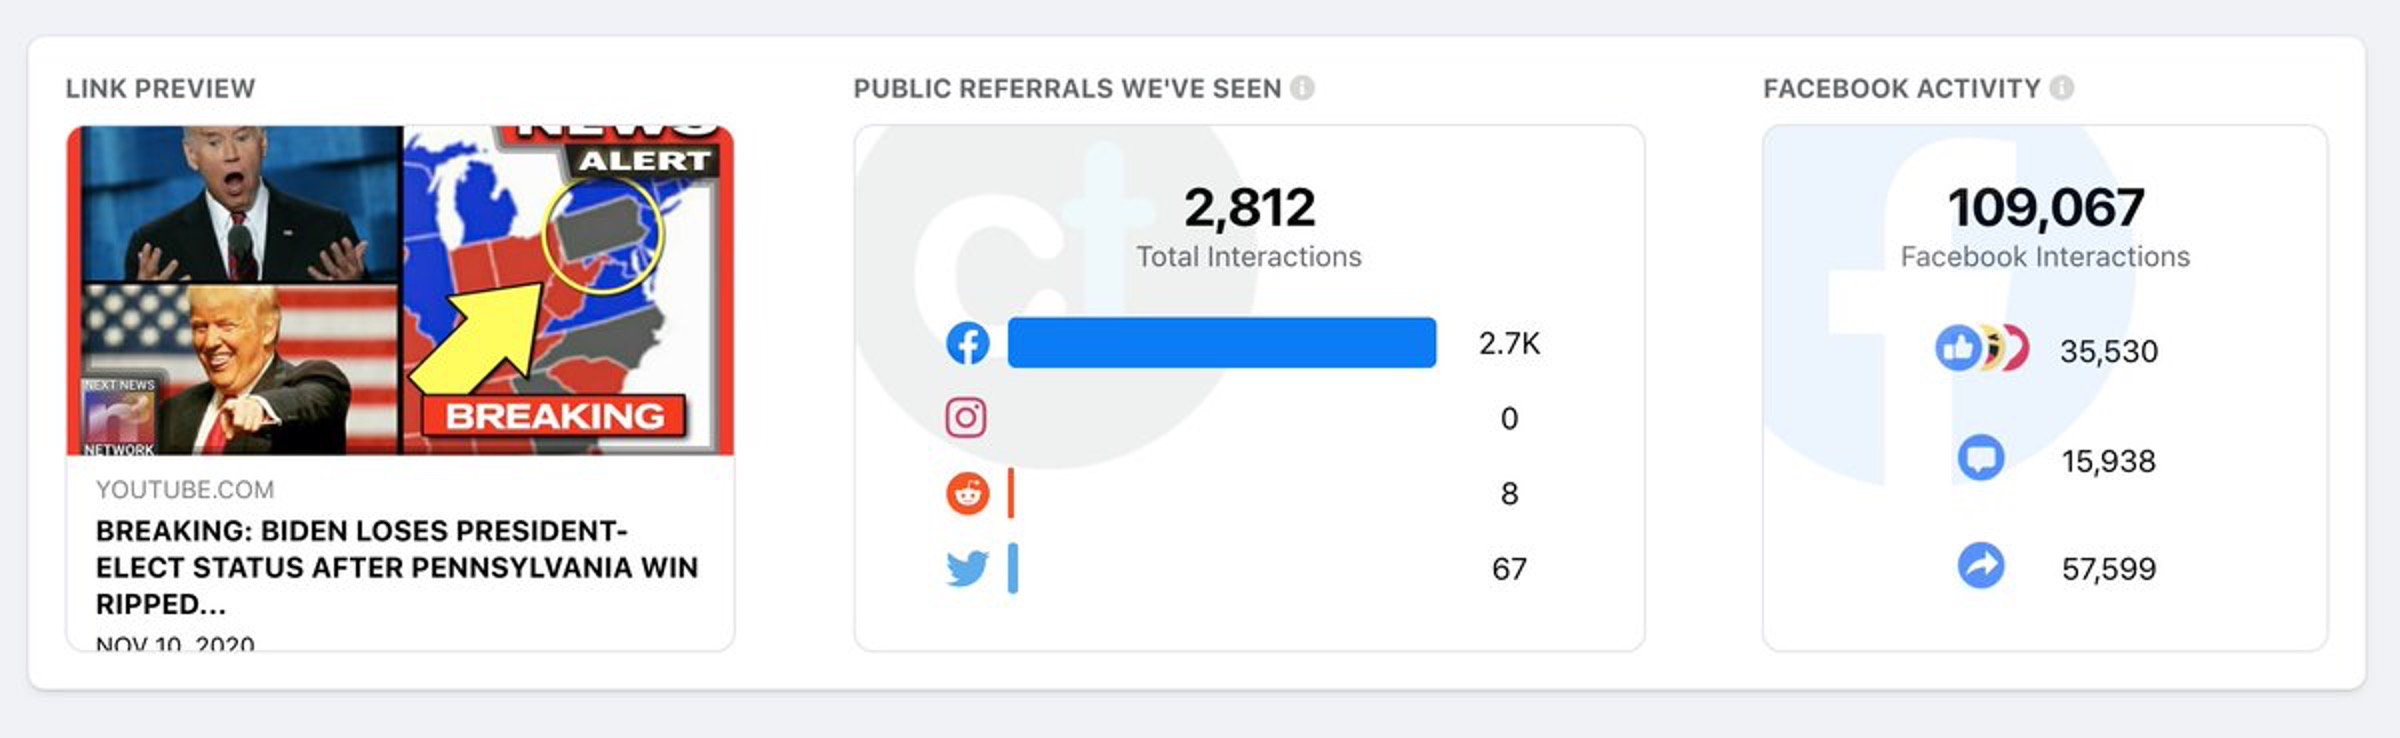
Public Spaces
(e.g., public pages, groups)
Private Spaces
(private groups, direct messages)
Understanding content dynamics requires examining both spaces.
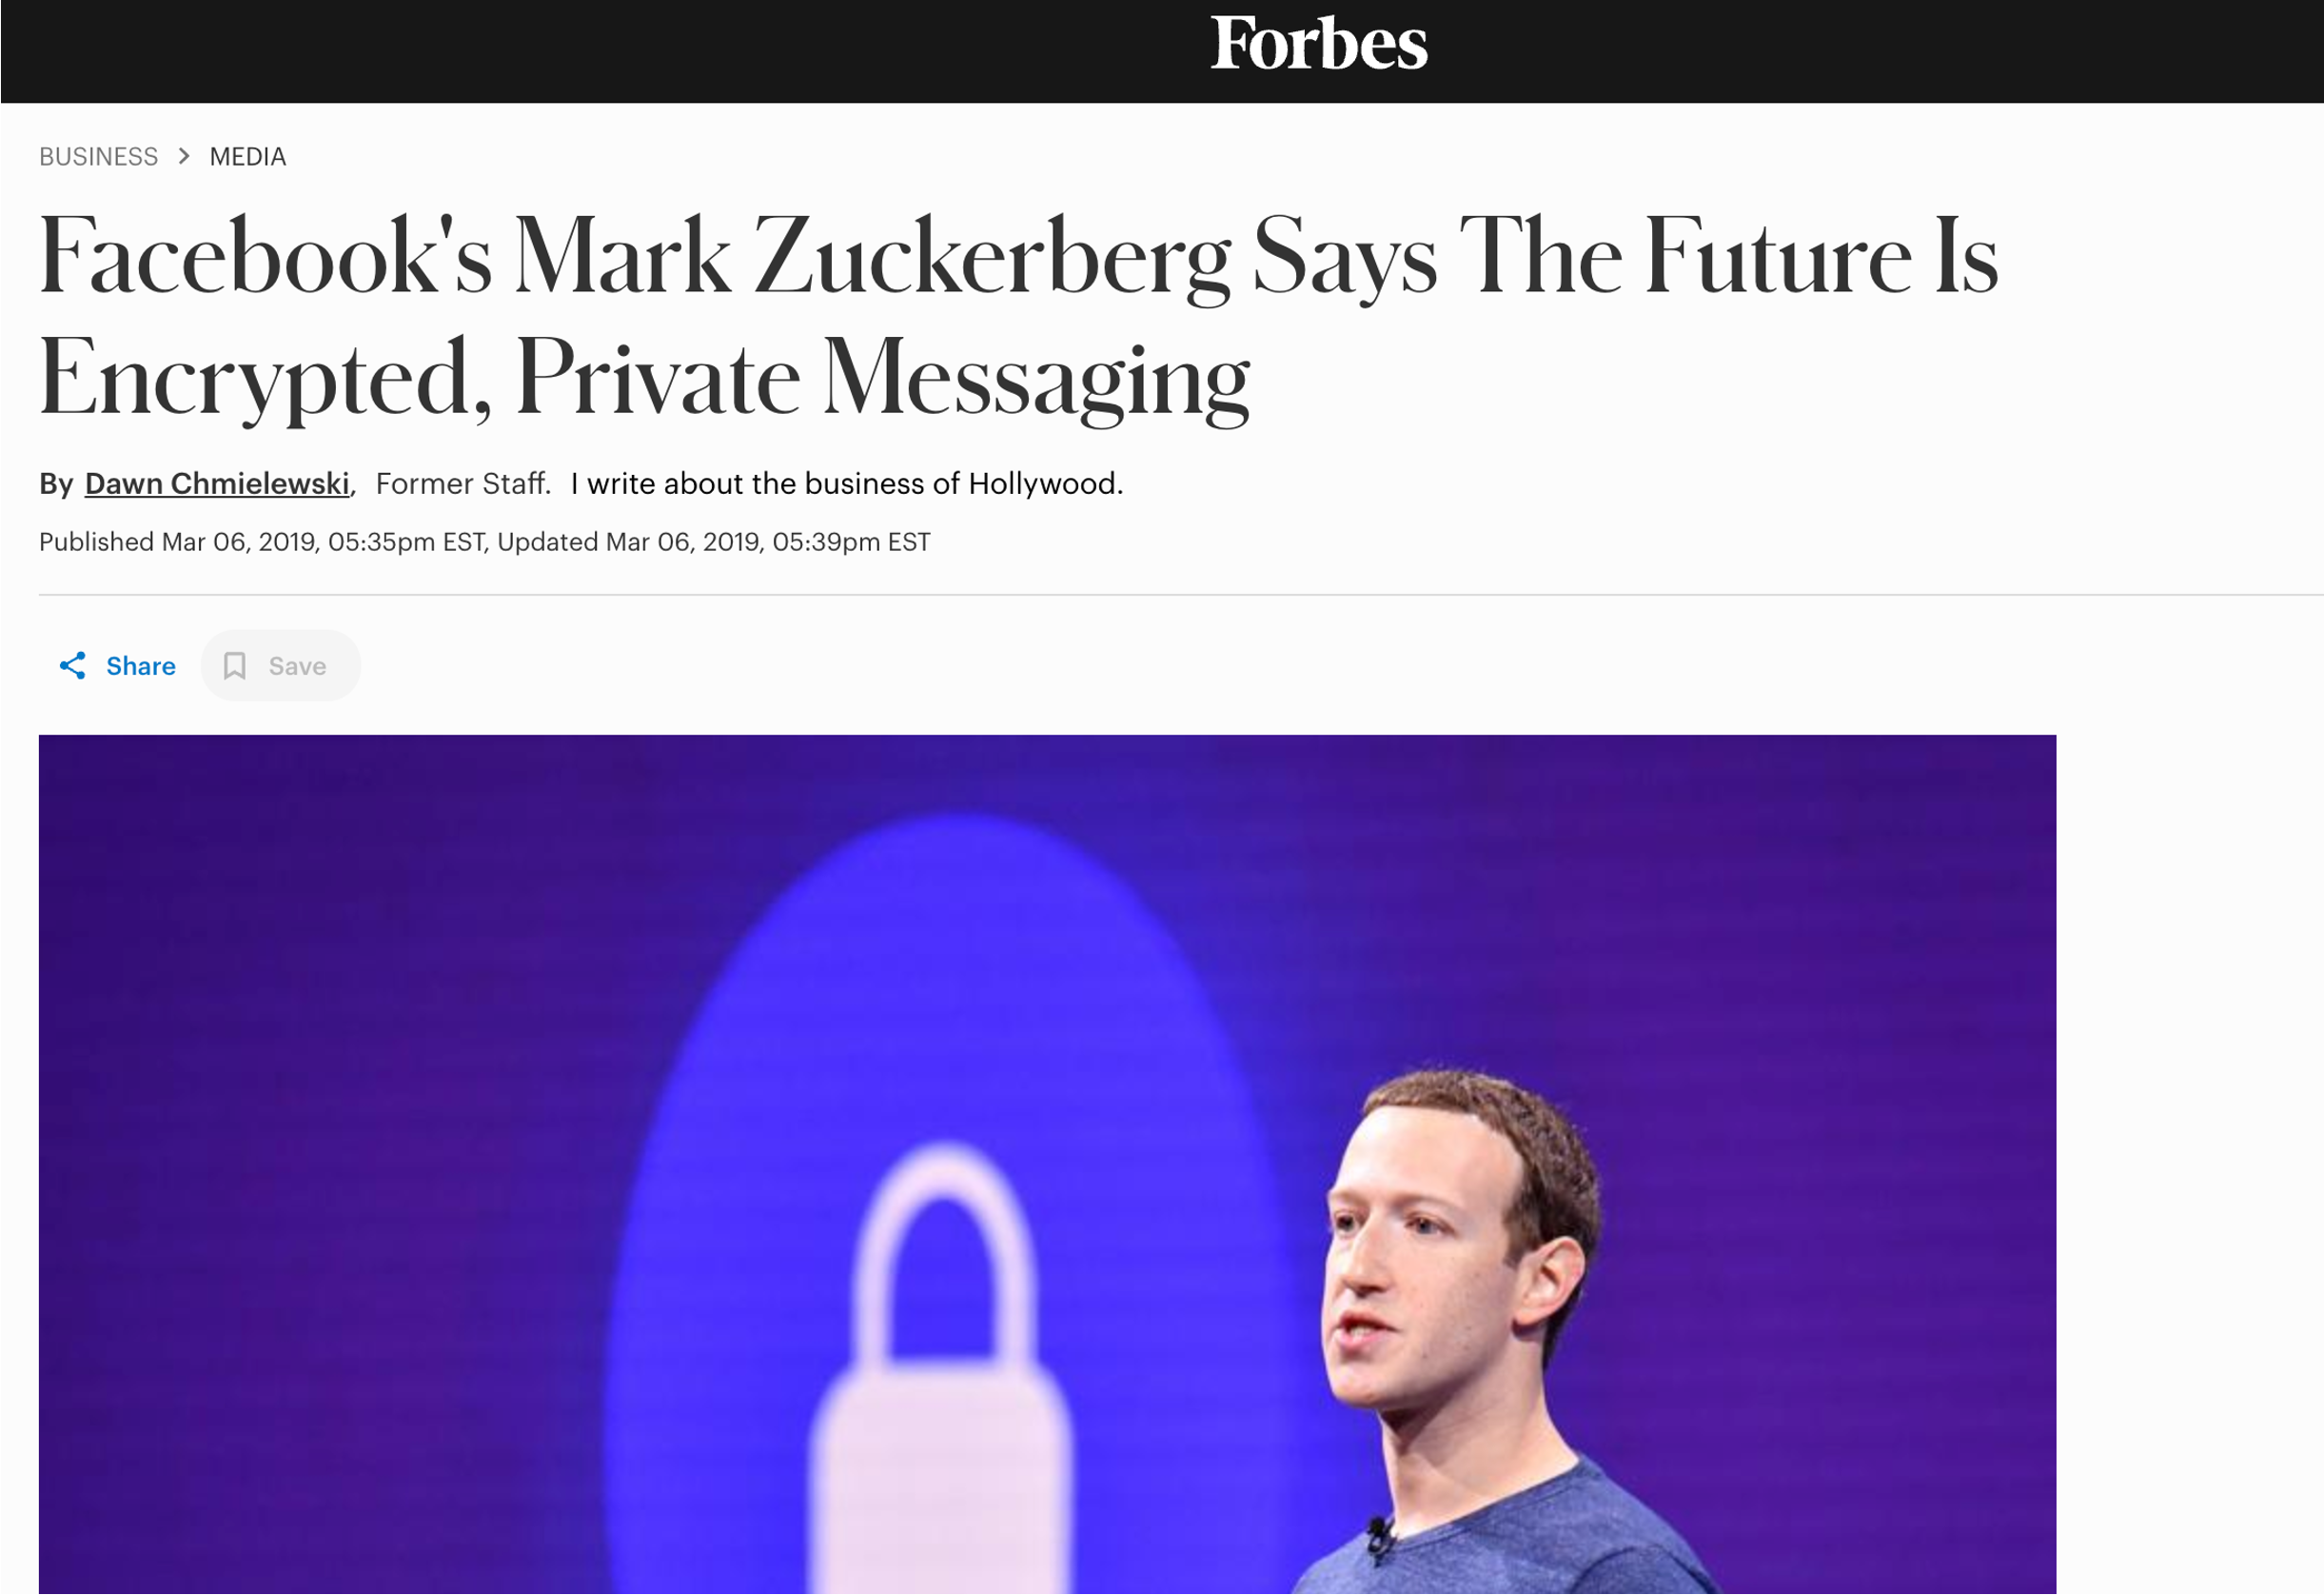
Platforms themselves are pivoting towards private, encrypted communication, acknowledging a massive shift in user behavior.
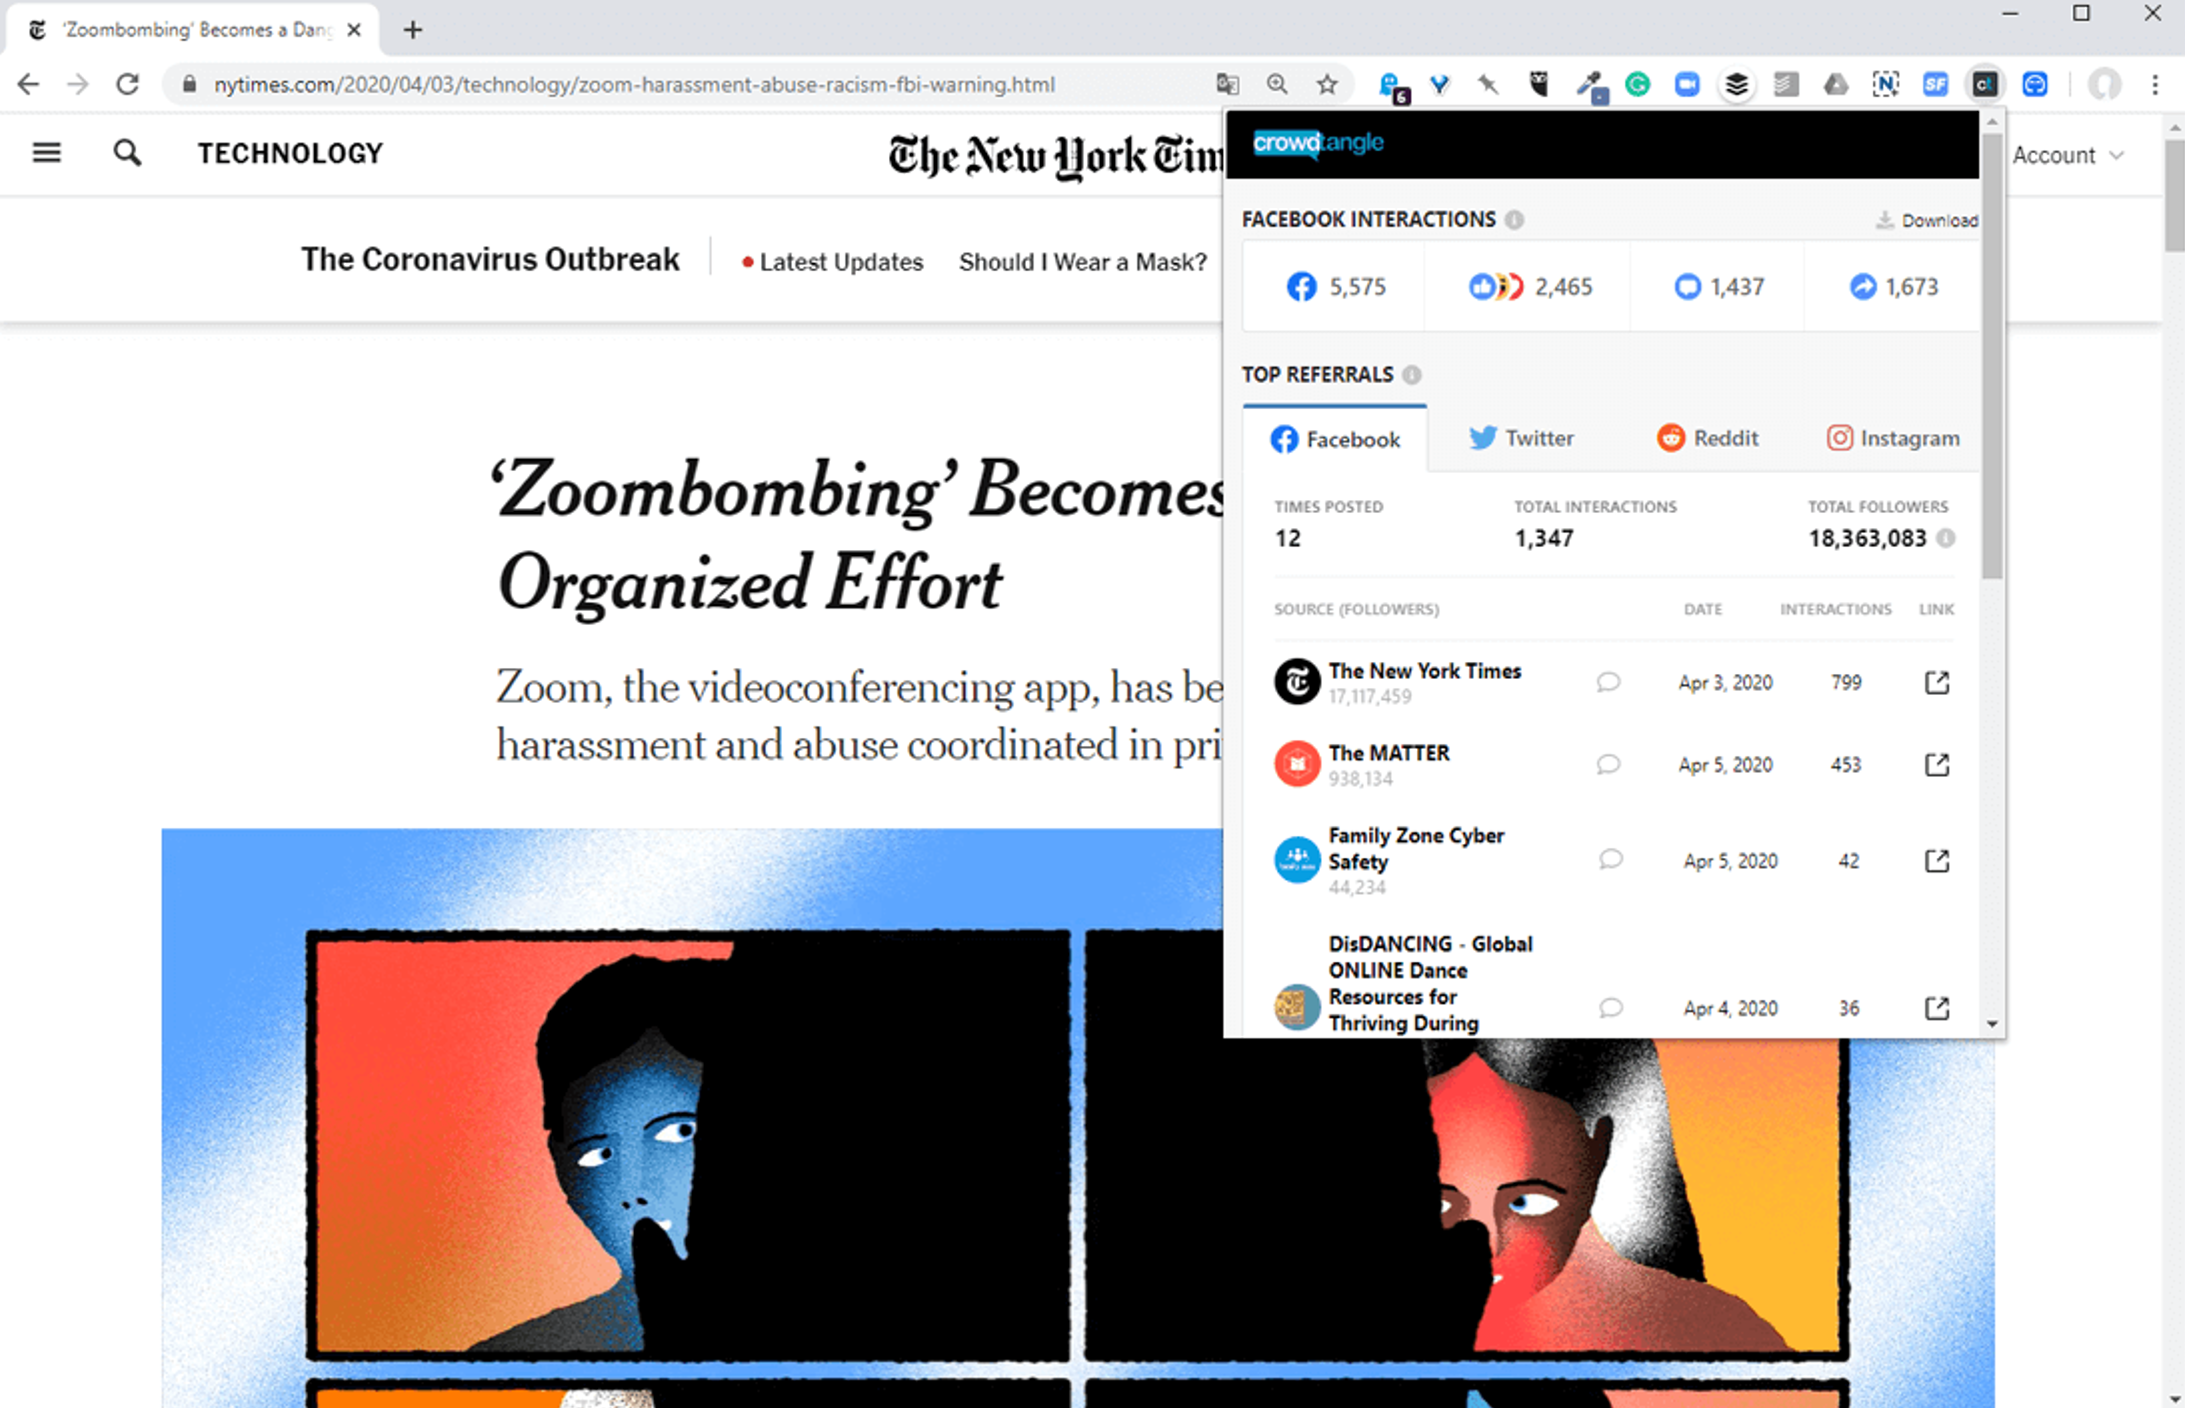
While we know this shift is happening, there has been no quantitative assessment of this "spillover". How much of the conversation are we missing by only looking at public data? This study is the first to measure it.
An incomplete picture of the information ecosystem leads to flawed conclusions.
This YouTube video spreading election misinformation shows nearly 1 million views. Standard research tools would see this high engagement.
But on Facebook, public data tools like CrowdTangle show only ~2,800 interactions. The other ~109,000 interactions happened privately, hidden from researchers.
Without accounting for private sharing, we would underestimate this link's Facebook reach by over 97%.
News outlets, creators, and marketers cannot gauge the true reach of their content if a majority of its shares are invisible. Public metrics like 'likes' or 'shares' on a page become vanity metrics if the bulk of dissemination and discussion happens in private DMs and groups.
Why do people share certain content (e.g., controversial topics, niche interests) privately? Understanding these motivations is crucial for platforms, policymakers, and researchers to grasp how online social behavior and discourse are evolving away from public town squares.
Using Meta's CrowdTangle to measure public and private shares.
The CrowdTangle Chrome Extension shows public interactions for a URL from Facebook Pages, public groups, and verified profiles.
The CrowdTangle Link Checker tool shows all Facebook activity, including public shares AND private shares (in DMs, private groups, etc.)
By combining these two data points, the study calculates:
A Ratio near 0 means mostly private sharing. A Ratio near 1 means mostly public sharing.
The study analyzed URLs from a wide variety of sources to get a holistic view.
NYT, Fox News
Breitbart, Newsmax
Misinformation sites
Snopes, PolitiFact
YouTube, Reddit, WhatsApp
Substack
Large topical dataset
Huffington Post data
Sharing behavior varies dramatically by source, topic, and category.
The chart shows the fraction of a source's URLs (y-axis) that have a public-to-total share ratio less than a certain value (x-axis).
Click labels on the chart to toggle sources!
This chart shows the extremes: the 5 most privately-shared and 5 most publicly-shared categories.
Topic modeling of COVID-19 news reveals a concerning trend.
The findings challenge conventional research methods and highlight critical gaps.
Studies focusing only on public data are missing the majority of sharing activity for many content types (e.g., 80%+ of mainstream news shares). This can lead to biased results and a flawed understanding of content reach and influence.
The high level of private sharing for low-quality and conspiratorial content means its true prevalence is hidden. This poses a major obstacle for researchers and fact-checkers trying to quantify and combat misinformation.
Since platform data access is limited, the paper calls for researchers to explore alternative models like privacy-preserving data donation and independent qualitative studies to better understand the dynamics of private sharing.